
Wealth and wage inequality touch on many of my favorite topics: Saving & Investing, Wealth & Wages, Real Estate & Consumer Spending, Behavioral Finance & Cognitive errors. People often make erroneous assumptions about the wealth and/or wage inequality data — they think it is 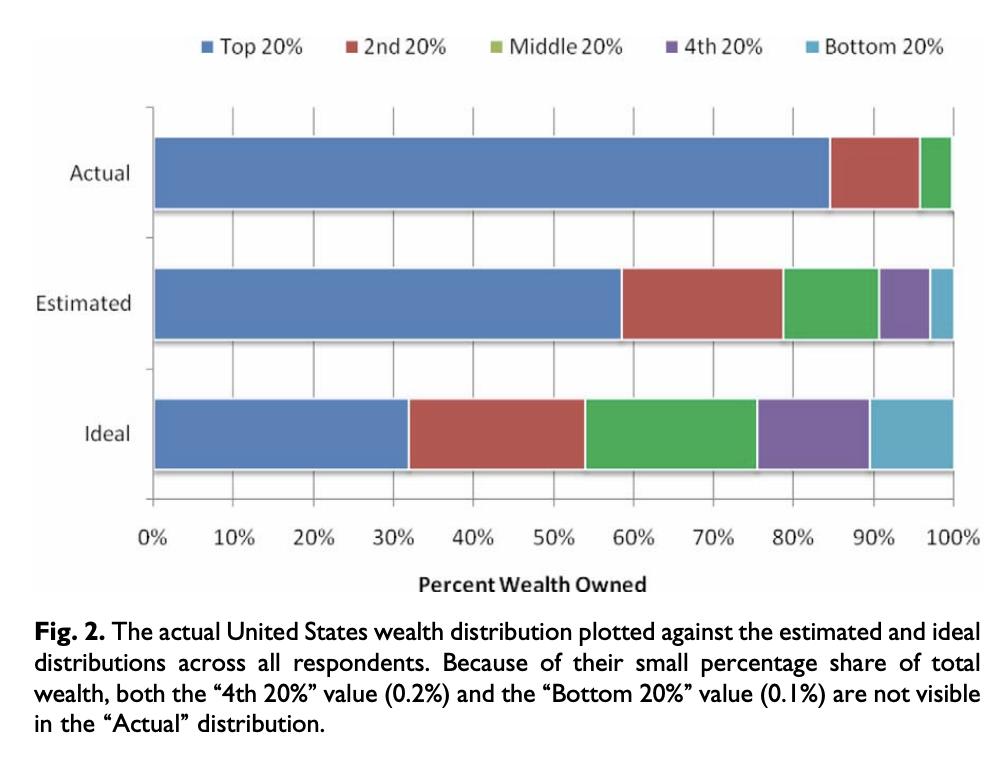 bad, but it’s much worse than they assume (see chart at right). This is a mostly (but not exclusively) American issue; Europe for example has less income and wealth inequality than we do here.
Most of all, it presents an opportunity to think about complex issues from vantage points that include financial, psychology, behavior, policy, even temporal. This is why I am always keen to check out any new analytical tool that gives us a fresh way to analyze the associated data.
The latest such tool comes from the economic trio of Thomas Blanchet, Emmanuel Saez, and Gabriel Zucman of the University of California Berkeley. They have introduced a very interesting new tool: Realtime Inequality. (H/T Paulie the K via Invictus; methodology here)
Let’s use this tool to do a little wage & wealth inequality analysis in real-time:
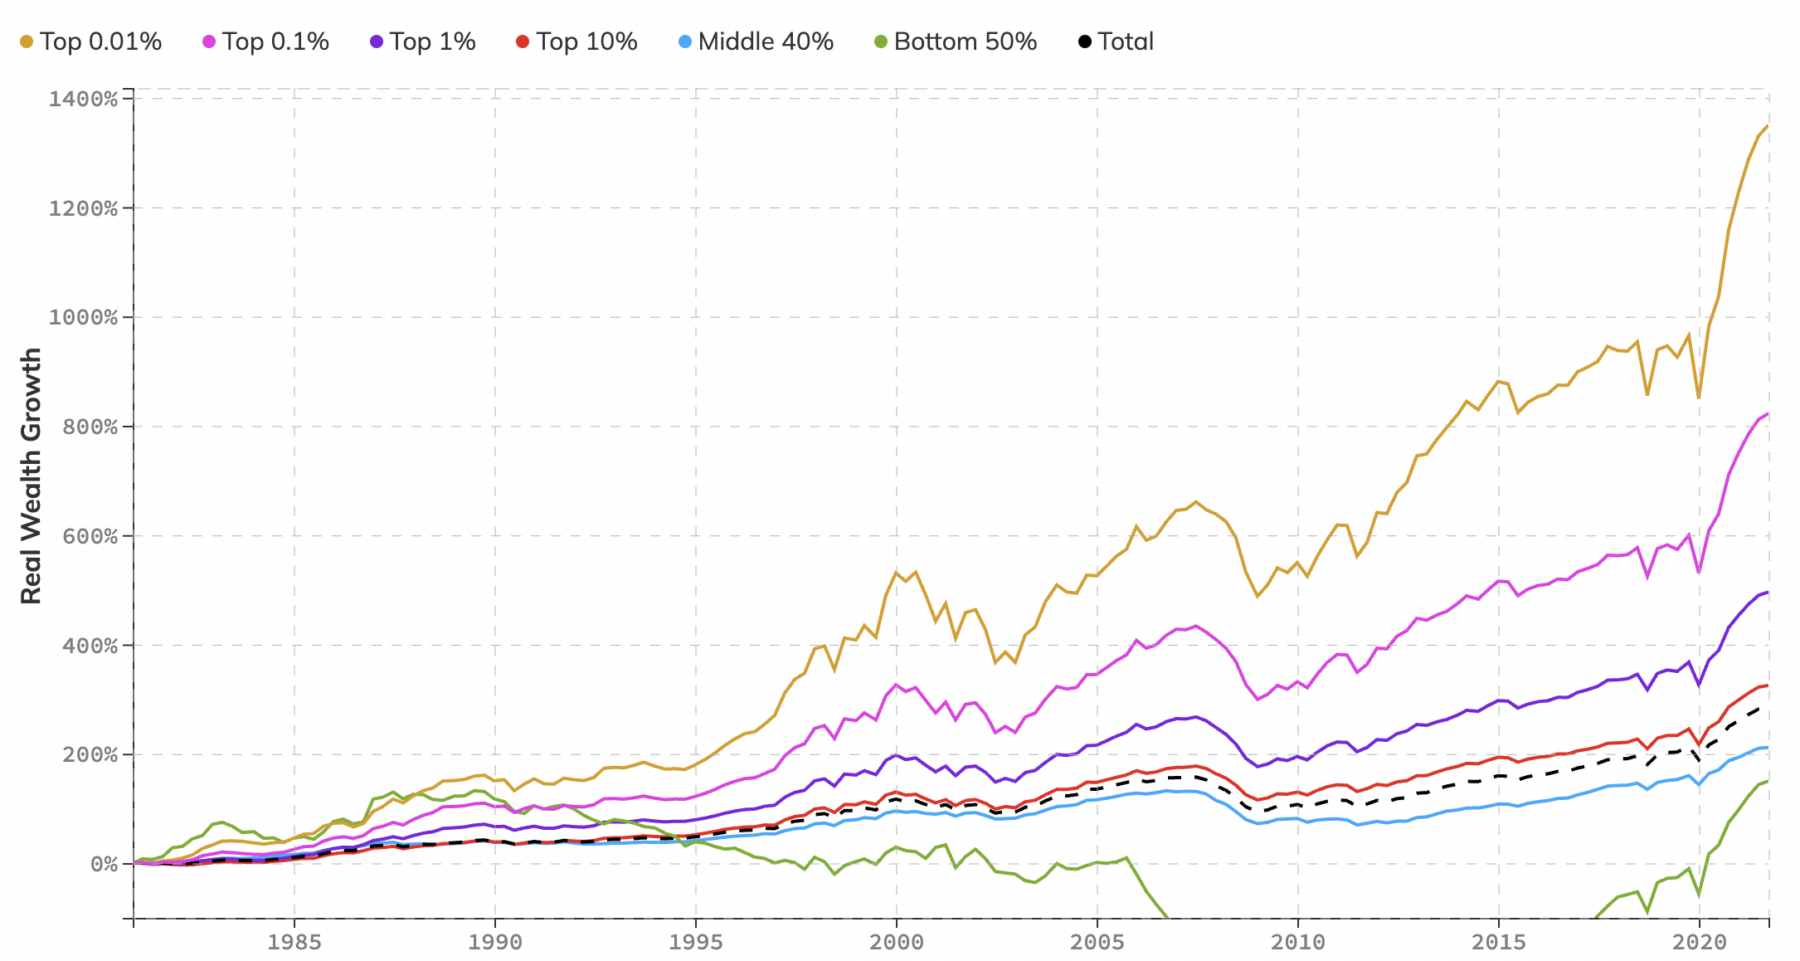
Confirming my priors, the Realtime Inequality data set and charts show just how lopsided wealth in America actually is; sure, the top 10% and top 1% have seen their wealth increase substantially over the past four decades, but it is almost modest compared to the top 0.1% and 0.01%. Those at the top of the pyramid have seen their fortunes disproportionately soar since the 1980s.
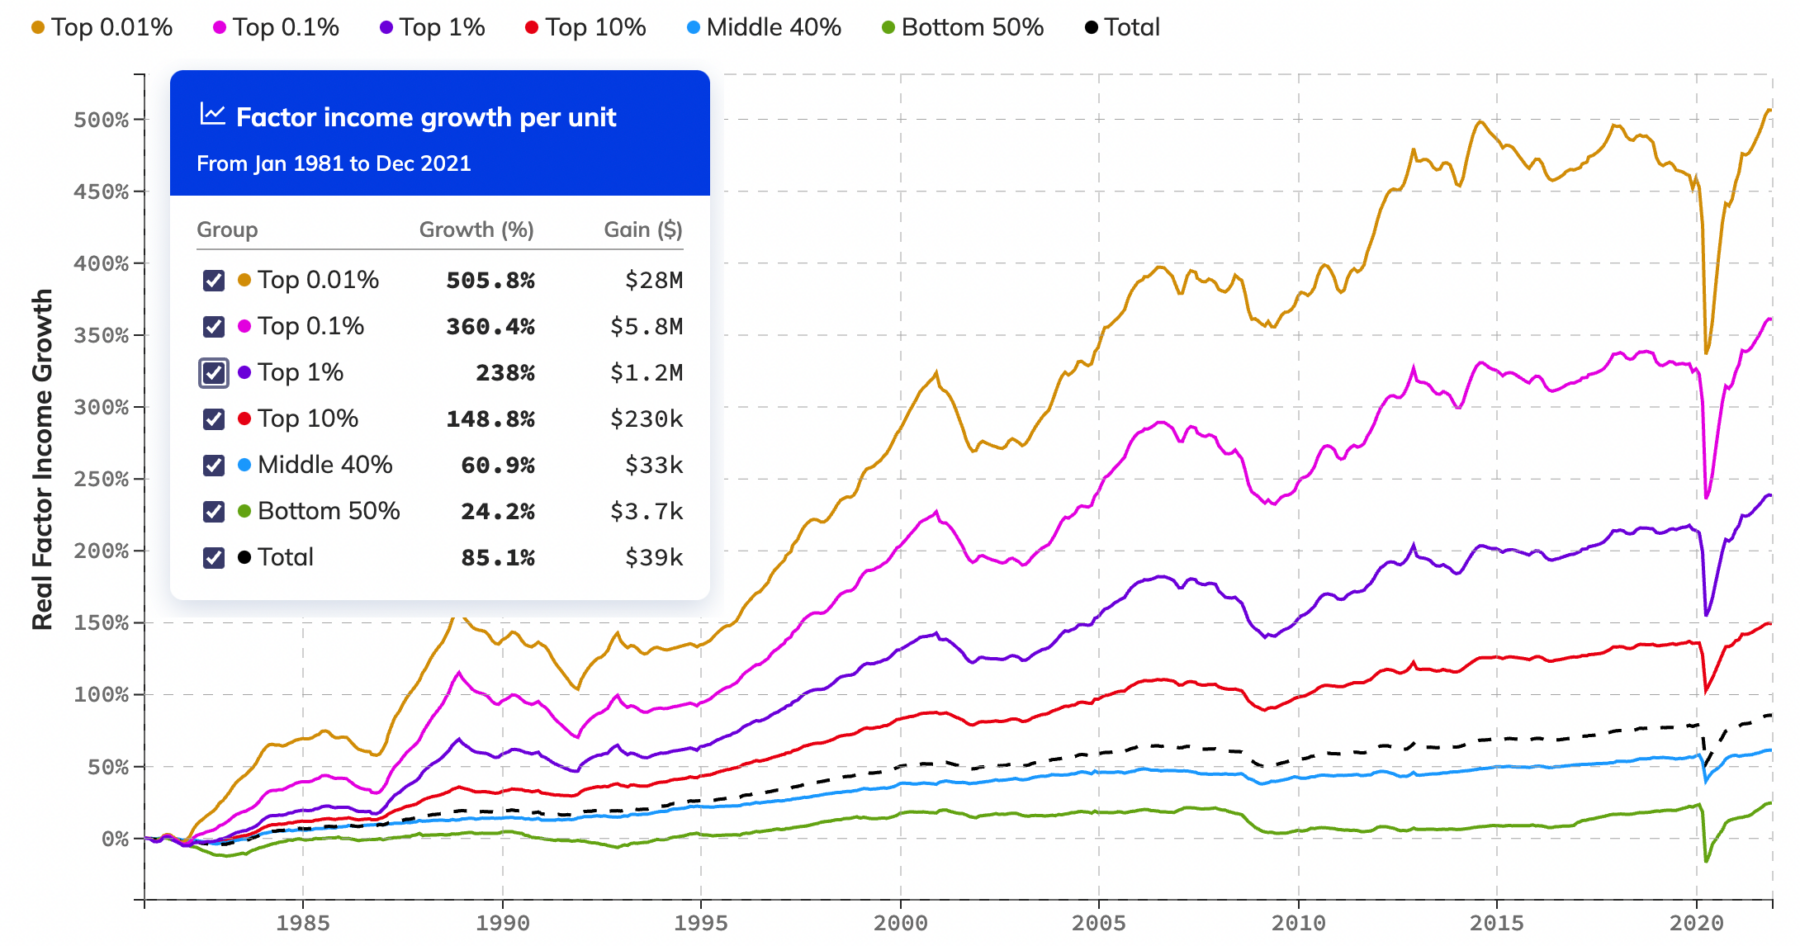
It’s generally well understood that the wealthier you are, the better you have done during the pandemic, since the GFC, or during the 1980s-90s bull market. But most people are not aware of exactly how lopsided those gains are. Consider the top 1% and various tiers in income: The top 1% has seen average income gains of $1.2m versus the top 10% adding $230k and the next 40% adding $33k. But those numbers are rounding errors compared to the income gains of the top 0.1% of $5.8m, and the top 0.01% of $28m.
Income Tier Comparison

Income Tier Comparison including Top 0.1% and 0.01%
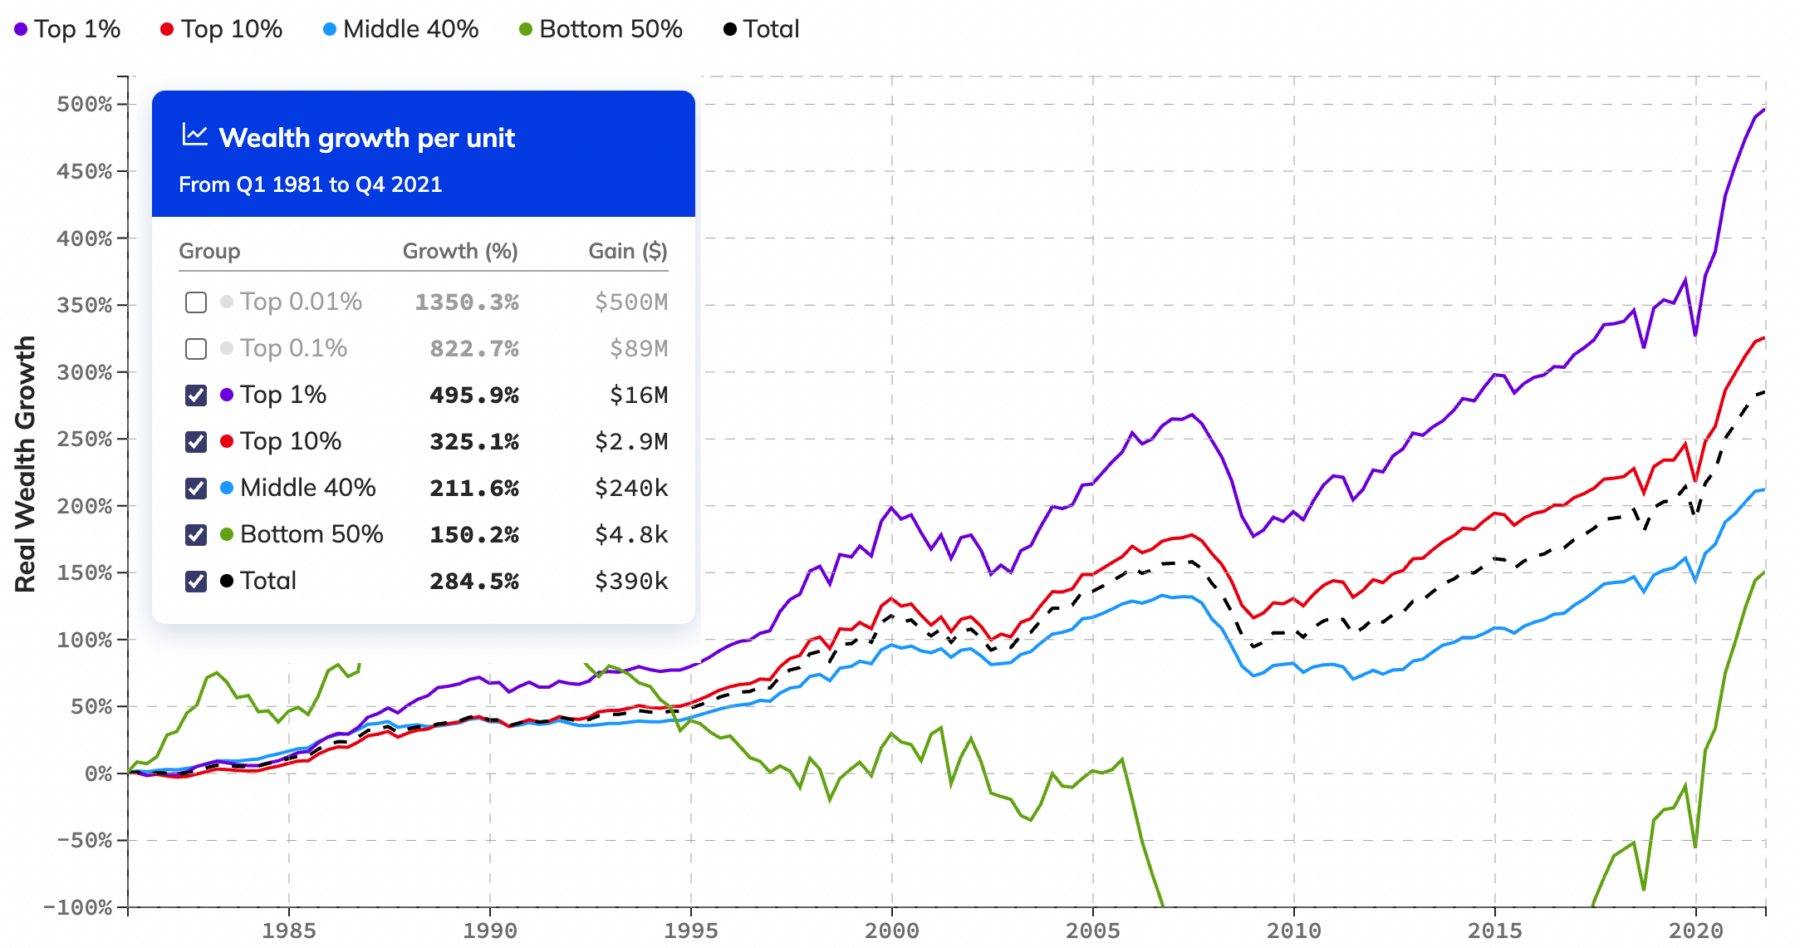
It is even starker when we compare wealth (typically public stocks and bonds, real estate, alternative investments, and privately held businesses). The top 1% added $16m in wealth over this time period versus the top 10% adding $2.9m and the next 40% adding $240k. Again we see these numbers dwarfed by the wealth gained by the top 0.1% of $89m, and the top 0.01% of $500m.
Half a billion in wealth gains on average for people in the top 0.01% is a surprising number:
Wealth Tier Comparison
Wealth Tier Comparison including Top 0.1% and 0.01%
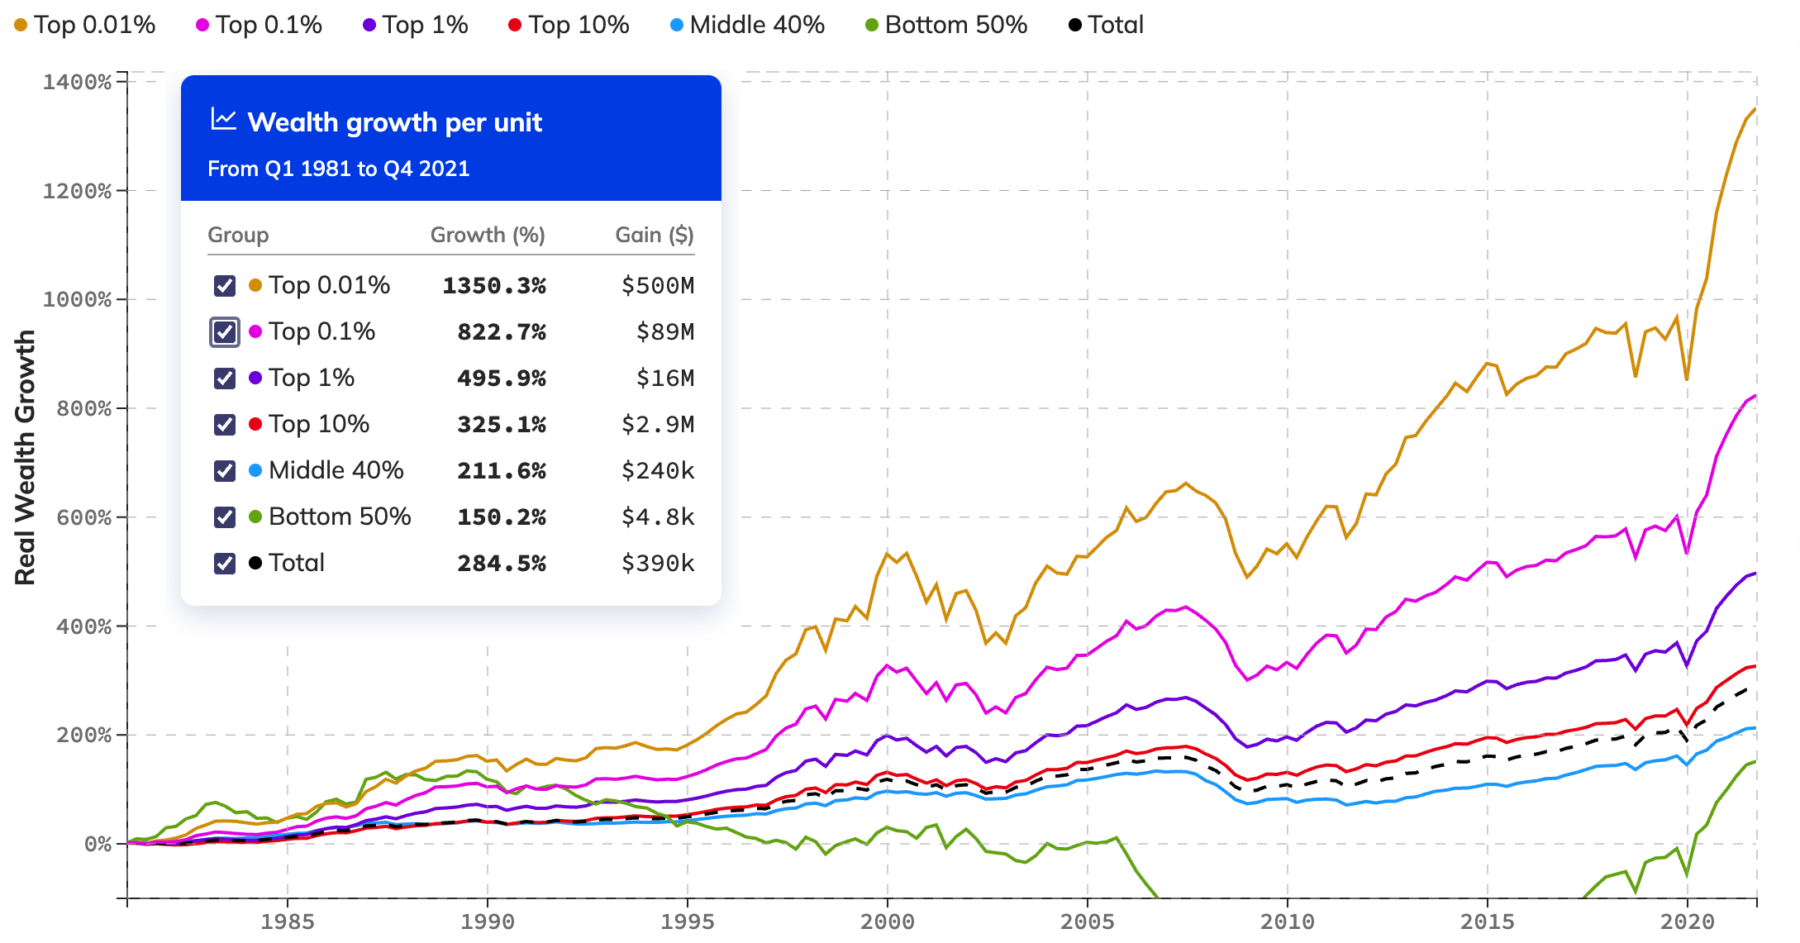
Compare the wealth gains among different economic tiers since 1981:
Bottom Half = $4.8k
Middle 40% = $240k
Top 10% = $2.9m
Top 1% = $16m
Top 0.1% = $89m
Top 0.01% = $500m
That is pretty astounding.
These are complex issues, and they can be emotional, politicized, and easy to misunderstand. But here is the bottom line: The difference between the top 1% or 10% and the bottom half of the country is relatively modest compared to this new category of super-wealthy. That has ramifications for all of society, whether people believe the nation is on the right track or not, and how policymakers might respond.
Source:
Realtime Inequality
Thomas Blanchet, Emmanuel Saez, Gabriel Zucman
Department of Economics | University of California, Berkeley
https://realtimeinequality.org/
Previously:
Wealth Distribution Analysis (July 18, 2019)
Composition of Wealth Differs: Middle Class to the Top 1% (June 5, 2019)
John D. Rockefeller Was Richer – Way Richer – Than You Are… (February 22, 2016)
Are the Poor Better Off Than King Louis XIV? January 16, 2015
Wealth Disparity Expands Further (November 13, 2019)
Wages in America (2013-2021)
Understanding Wealth Comparisons (2004-2020)
